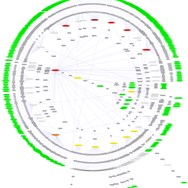
Graphviz
Graphviz is a powerful open-source graph visualization software package. It allows users to create complex diagrams and graphs from descriptive text files using the DOT language. Ideal for professionals, researchers, and developers needing to represent structured information visually.
License
Open SourcePlatforms
About Graphviz
Graphviz provides a robust suite of tools for drawing diagrams and graphs programmatically. At its core is the DOT language, a simple yet expressive text format for describing graph structures.
Key features include:
- Automatic Layout Algorithms: Graphviz offers several sophisticated layout engines (like dot, neato, twopi, circo, fdp) that automatically arrange nodes and edges, providing clear and aesthetically pleasing visualizations for various graph types (directed, undirected, hierarchical).
- High-Quality Output Formats: Generate diagrams in numerous formats, including SVG (Scalable Vector Graphics), PNG, JPEG, PDF, and PostScript, ensuring compatibility with various applications and high-resolution output for printing and publishing.
- Customizable Appearance: Extensive options for controlling the visual appearance of nodes, edges, and labels, including colors, shapes, fonts, line styles, and more, allowing for tailored visualizations.
- Integration and Extensibility: As open-source software with a text-based input format, Graphviz is easily integrated into other applications, scripts, and workflows. Its modular design allows for potential extensions and custom solutions, though these require development effort.
Graphviz is particularly well-suited for generating diagrams like flowcharts, organizational charts, network diagrams, entity-relationship diagrams, and UML-like class diagrams directly from data or scripts, automating the visualization process and ensuring consistency.
Pros & Cons
Pros
- Automated generation of complex diagrams from text.
- Supports various sophisticated layout algorithms.
- High-quality vector graphics output (SVG, PDF).
- Free and open source.
- Excellent for version control and collaboration via text files.
- Highly customizable appearance via DOT attributes.
Cons
- Requires learning the DOT language; no direct drag-and-drop editing.
- Can be less intuitive for simple, one-off diagrams compared to GUI tools.
- Steeper learning curve for users unfamiliar with command-line tools.
What Makes Graphviz Stand Out
Programmatic Diagram Generation
Create complex diagrams automatically from data or scripts using a simple text language.
Variety of Layout Algorithms
Offers multiple sophisticated algorithms to find the best layout for different types of graphs.
Open Source and Free
Powerful and fully-featured graph visualization available at no cost with source code access.
Features & Capabilities
10 featuresExpert Review
Graphviz: A Review of the Graph Visualization Software
Graphviz is a well-established open-source software package dedicated to graph visualization. Its fundamental approach revolves around using a textual description language, DOT, to define nodes, edges, and their attributes. The software then processes this description through various layout engines to produce visual representations of the graph.
The power of Graphviz lies in its programmatic nature. Instead of manually arranging elements on a canvas, users write a simple script describing the graph structure. This text-based input format is highly advantageous for several reasons:
- Version Control: DOT sources can be easily managed using version control systems like Git.
- Automation: Diagrams can be generated from databases, log files, or other data sources automatically.
- Consistency: Ensures uniform styling and layout across multiple diagrams derived from similar structures.
- Collaboration: Sharing and reviewing text files is often simpler than sharing binary image or diagram files.
Graphviz provides several layout engines, each optimized for different types of graphs. For instance, the 'dot' engine is excellent for directed acyclic graphs (hierarchical structures like flowcharts), while 'neato' is better suited for undirected graphs and emphasizes node proximity based on connectivity. The availability of these varied algorithms is a significant strength, allowing users to choose the best approach for their specific data.
The output capabilities of Graphviz are extensive. It supports a wide array of image formats, including raster types like PNG and JPEG, embedded formats like PostScript and PDF, and crucially, vector graphics like SVG. SVG output is particularly valuable as it allows diagrams to be scaled without loss of quality, making them suitable for web display, presentations, and high-resolution printing. The level of customization available for the appearance of nodes, edges, and labels through attributes in the DOT language is very granular, allowing for highly tailored visualizations.
From a usability standpoint, Graphviz is not a drag-and-drop GUI editor. It requires users to learn the DOT language. While the language is relatively simple and well-documented, this initial learning curve can be a barrier for users accustomed to visual diagramming tools. However, for those working with large datasets, frequently updated diagrams, or requiring automated generation, the text-based workflow is far more efficient than manual manipulation.
Integration with other tools and workflows is straightforward due to the text input and command-line interface. Graphviz can be easily called from scripts in various programming languages (Python, Ruby, PHP, etc.) or incorporated into build processes. While there are some third-party GUI frontends and editors that can assist with generating DOT code or visualizing existing diagrams, the core Graphviz experience is command-line driven.
The software's open-source nature means it is free to use and has a community supporting its development and providing resources. Documentation is comprehensive and readily available on the official website, including examples to help users get started with the DOT language and various layout options.
In conclusion, Graphviz is a powerful, mature, and flexible tool for graph visualization. Its text-based approach, while requiring a different mindset than GUI editors, offers significant advantages in automation, consistency, and integration. The variety of layout engines and extensive output options make it suitable for a wide range of applications, from software engineering diagrams and network mapping to biological pathways and data structures. While perhaps not the ideal tool for occasional, simple diagrams, it is an indispensable asset for anyone who needs to generate complex, dynamic, or large-scale graph visualizations programmatically.


