SciDaVis
SciDAVis is a free and open-source application for scientific data analysis and visualization, providing powerful tools for plotting and data manipulation specifically designed for scientists and engineers.
License
Open SourcePlatforms
About SciDaVis
SciDAVis (Scientific Data Analysis and Visualization) is a robust and flexible application tailored for the demanding tasks of scientific data analysis and visualization. Built with scientists and engineers in mind, it offers a comprehensive suite of tools to import, process, and plot data from various sources. The software aims to be an open-source alternative to commercial packages, providing a powerful platform without licensing costs.
Key capabilities include:
- Data Import and Management: Easily import data from ASCII files, spreadsheets, and databases. Organize data into tables with multiple columns and rows.
- Data Manipulation: Extensive tools for data transformation, cleaning, and manipulation. Perform column operations, analyze data statistics, binning, and smoothing.
- High-Quality Plotting: Generate a wide range of 2D and 3D plot types, including line plots, scatter plots, bar charts, histograms, heatmaps, and surface plots. Customize every aspect of your plots for publication-quality output.
- Curve Fitting: Perform linear and nonlinear curve fitting using a variety of built-in functions or custom user-defined functions. Analyze fit parameters and generate confidence intervals.
- Scripting Interface: Automate tasks and extend functionality through a powerful scripting interface, supporting languages like PythonScript and QSA (Qt Script for Applications).
- Export Options: Export plots and data in various formats, including image files (PNG, JPG, TIFF, PDF, EPS) and data files, for use in presentations, publications, and other applications.
SciDAVis is developed with a focus on usability and provides a graphical user interface that is familiar to users of similar software. Its open-source nature encourages community contributions and ensures ongoing development and support.
Pros & Cons
Pros
- Completely free and open source.
- Generates high-quality, customizable plots.
- Includes curve fitting capabilities.
- Features a scripting interface for automation.
- Cross-platform compatibility.
Cons
- May lack some advanced statistical analysis features.
- Documentation could be more detailed for some features.
- Performance on very large datasets might be less optimal than commercial alternatives.
What Makes SciDaVis Stand Out
Free and Open Source
SciDAVis is completely free to use and distribute, with source code available for inspection and modification.
Cross-Platform Compatibility
Available on multiple operating systems, including Windows, macOS, and Linux, allowing for consistent workflow across different environments.
Scientific Focus
Designed specifically for the needs of scientific and engineering professionals, providing tools relevant to research and analysis.
Features & Capabilities
8 featuresExpert Review
SciDAVis: A Capable Open-Source Alternative for Scientific Data Analysis
SciDAVis stands as a commendable open-source solution in the realm of scientific data analysis and visualization. For anyone dealing with scientific data and seeking a robust, free alternative to commercial giants, SciDAVis offers a compelling package of features.
The software's core strength lies in its ability to efficiently handle and visualize scientific datasets. Data import is straightforward, supporting common formats that are standard in scientific workflows. Once data is loaded into the tabular format, users have access to a reasonable set of data manipulation tools. While not as extensive as some commercial offerings, the provided functions for column operations, basic statistics, and data transformations are sufficient for many common tasks. The inclusion of binning and smoothing functionalities is particularly useful for preparing data for plotting and analysis.
Where SciDAVis truly shines is in its plotting capabilities. The range of 2D and 3D plot types is quite comprehensive, covering most of the essential visualizations required in scientific contexts – line plots, scatter plots, bar charts, histograms, and surface plots are all readily available. The level of customization offered for plots is impressive. Users can meticulously control aspects like axis labels, legends, colors, line styles, and markers, enabling the creation of publication-quality figures. This flexibility in plot customization is a significant advantage, allowing researchers to present their data clearly and effectively.
The curve fitting functionality is another valuable asset. SciDAVis provides a selection of built-in linear and nonlinear fitting models. More importantly, the ability to define custom fitting functions extends its applicability to a wider range of experimental data. The analysis of fit parameters and the generation of confidence intervals are crucial for drawing meaningful conclusions from the data.
For users who require automation or need to perform repetitive tasks, the scripting interface is a powerful addition. Support for PythonScript and QSA allows users to write scripts to automate data processing, plotting, and analysis workflows. This can significantly improve efficiency, especially when dealing with large datasets or complex analysis routines. While the scripting documentation could be more extensive, the presence of this feature greatly enhances the software's utility for power users.
The user interface is generally intuitive and follows a layout familiar to those who have used similar scientific plotting software. This minimizes the learning curve for new users transitioning from other platforms. Navigation through the different windows (tables, plots, log messages) is logical.
As an open-source project, SciDAVis benefits from community contributions and active development. This fosters ongoing improvements and ensures that the software remains relevant and addresses the evolving needs of the scientific community. The absence of licensing costs makes it an attractive option for researchers, students, and institutions with budget constraints.
However, there are areas where SciDAVis could be improved. While the basic statistics tools are helpful, more advanced statistical analysis features would enhance its capabilities as a complete data analysis package. The documentation, while present, can sometimes be less detailed than desired for complex operations or advanced features like scripting. Some users might also find the performance on very large datasets to be less responsive compared to highly optimized commercial software.
In conclusion, SciDAVis is an excellent free and open-source tool for scientific data analysis and visualization. Its strong plotting capabilities, useful data manipulation tools, and powerful scripting interface make it a viable alternative for many scientific tasks. While it may lack some of the advanced statistical and data handling features found in high-end commercial software, its core strengths and open-source nature make it a highly recommended option for anyone working with scientific data, particularly those looking for a cost-effective and flexible solution.
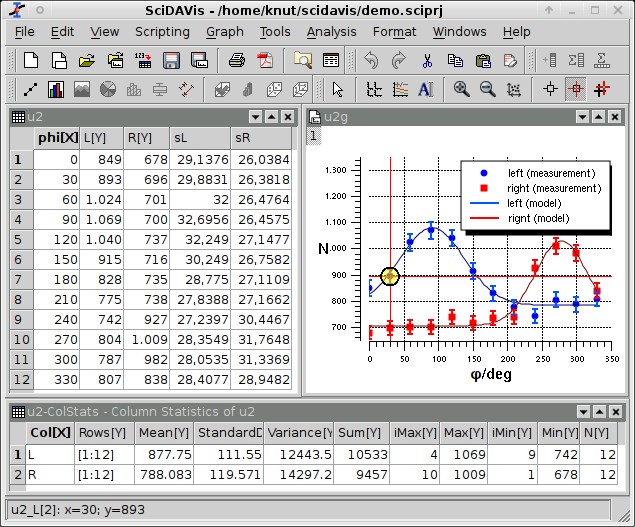
Screenshots