AnyChart
AnyChart provides comprehensive JavaScript charting libraries for creating interactive data visualizations. It offers a range of tools including charts, stock charts, maps, and Gantt charts, catering to various data visualization needs across platforms.
License
CommercialCategories
Platforms
About AnyChart
AnyChart is a powerful and versatile suite of JavaScript libraries designed to help developers create stunning and interactive data visualizations. With support for a wide array of chart types, maps, stock charts, and project management visualizations like Gantt charts, AnyChart provides the building blocks for turning complex data into readily understandable graphical representations. Its cross-platform compatibility ensures that visualizations render correctly across different devices and operating systems, making it ideal for web and mobile applications.
Key components of the AnyChart platform include:
- AnyChart: The core charting library offering a vast selection of 2D and 3D charts.
- AnyStock: Specialized for financial charting and technical analysis with advanced features for displaying time-series data.
- AnyMap: Enables the creation of interactive maps to visualize geo-spatial data.
- AnyGantt: Focused on project and resource management visualizations like Gantt charts and resource charts.
AnyChart's flexibility is further enhanced by its extensive API and detailed documentation, allowing developers to customize every aspect of the visualizations. Whether you need to display simple bar charts or complex hierarchical data, AnyChart offers the tools and flexibility to achieve your data visualization goals.
Pros & Cons
Pros
- Extensive range of chart types and visualization tools.
- Comprehensive libraries for charts, stock, maps, and Gantt.
- High level of customization through a detailed API.
- Good performance even with large datasets.
- Cross-platform compatibility with HTML5 and JavaScript.
Cons
- Can have a learning curve due to the extensive features and API.
- Licensing costs may be a factor for widespread commercial use.
What Makes AnyChart Stand Out
Comprehensive Suite
Offers a complete set of libraries for charts, stock charts, maps, and Gantt charts, covering a wide range of data visualization needs.
Extensive Customization
Provides a rich API for granular control over all visual elements and behaviors.
Features & Capabilities
10 featuresExpert Review
AnyChart Software Review
AnyChart is a mature and robust suite of JavaScript libraries for creating interactive data visualizations. The platform's strength lies in its comprehensive offering, covering traditional charts, financial charts, maps, and project management visualizations.
Charting Capabilities:
The core AnyChart library provides an extensive collection of chart types. From basic bar and line charts to more complex funnel, pyramid, and polar charts, the variety is impressive. Support for 3D charts adds another dimension to data representation. The interactive features, such as tooltips, zooming, and panning, are well-implemented and enhance user engagement with the data.
Financial Charting (AnyStock):
For financial applications, AnyStock is a powerful tool. It includes specialized chart types like Candlestick, OHLC, and Heikin-Ashi, along with support for technical indicators and drawing tools. The ability to handle large datasets efficiently is crucial for financial data and AnyStock performs well in this regard.
Mapping (AnyMap):
AnyMap allows developers to build interactive maps for visualizing geographical data. Support for various map types and the ability to integrate custom maps make it flexible. The visualization of data on maps using techniques like bubble maps and dot maps provides valuable spatial insights.
Project Management Visualizations (AnyGantt):
AnyGantt is dedicated to creating professional Gantt charts and resource charts. Features for managing tasks, dependencies, milestones, and resources are well-integrated. This library is particularly useful for project management software and dashboards.
Customization and API:
A significant advantage of AnyChart is its extensive API. Developers have fine-grained control over the appearance and behavior of every element in the charts. This level of customization allows for creating visualizations that perfectly match specific branding and design requirements. The documentation is thorough and provides ample examples to help developers get started and explore advanced features.
Performance:
AnyChart libraries are designed with performance in mind, capable of handling large datasets without significant performance degradation. Features like data grouping and filtering help optimize rendering for voluminous data.
Cross-Platform Compatibility:
Built on HTML5 and JavaScript, AnyChart visualizations are inherently cross-platform, working seamlessly in modern web browsers and various devices. This is a key advantage for applications that need to reach a broad audience.
Integration:
AnyChart integrates well with popular web development frameworks and data sources. The data formatting and loading options are flexible, allowing developers to connect to various data backends.
Considerations:
While AnyChart is powerful, the breadth of features and the detailed API can have a learning curve, especially for developers new to data visualization libraries. The licensing model is also a factor to consider, particularly for commercial applications.
Conclusion:
AnyChart is a professional-grade suite of data visualization libraries that provides a comprehensive set of tools for creating interactive charts, stock charts, maps, and Gantt charts. Its strength lies in the sheer variety of visualization options, extensive customization capabilities, and robust performance. For developers needing a powerful and flexible solution for diverse data visualization needs, AnyChart is a strong contender. While there is a learning investment, the capabilities offered make it a worthwhile choice for complex and professional data visualization projects.
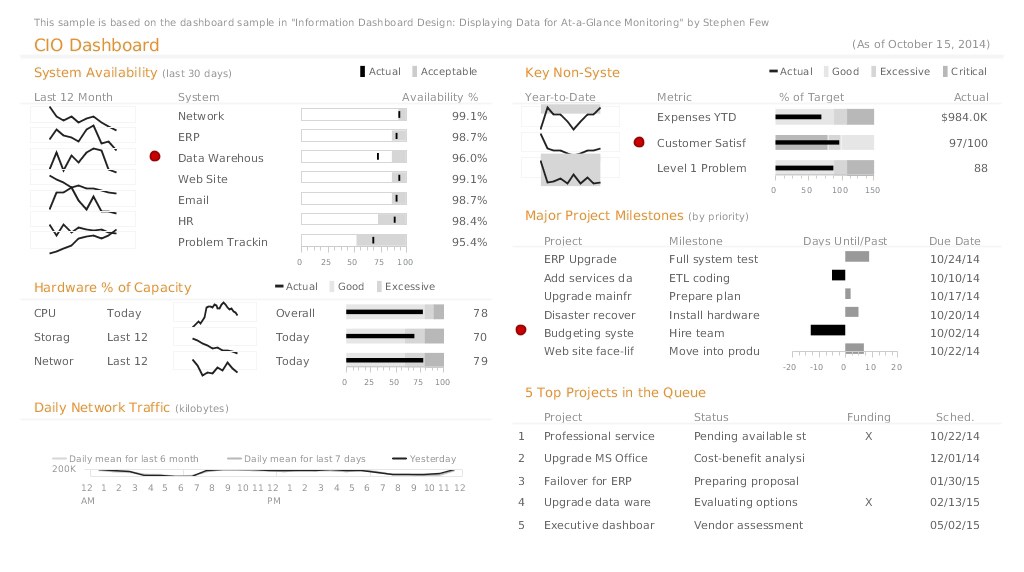
Screenshots