D3.js
D3.js is a powerful JavaScript library designed for creating dynamic, interactive, and data-driven documents, primarily focusing on complex data visualizations in modern web browsers. It leverages existing web technologies like HTML, SVG, and CSS.
About D3.js
Explore the Power of Data-Driven Documents with D3.js
D3.js, or Data-Driven Documents, stands as a cornerstone in the realm of web-based data visualization. Unlike charting libraries that offer pre-built chart types, D3 provides a lower-level, more granular control over graphical elements. This allows developers to bind arbitrary data to a Document Object Model (DOM), and then apply data-driven transformations to the document.
At its core, D3 empowers developers to:
- Bind Data: Connect datasets directly to HTML, SVG, or CSS elements.
- Transform Elements: Modify the visual properties (position, color, size, etc.) of these elements based on the bound data.
- Create Transitions: Implement smooth, animated transitions between different data states, enhancing user experience.
The flexibility of D3.js is its key strength. Instead of being limited to a predefined set of charts, users can design and implement virtually any type of visualization imaginable. This includes not only standard bar charts and line graphs but also complex network diagrams, treemaps, geographic visualizations, and custom infographics.
Key functionalities and features include:
- DOM Manipulation: D3 provides a rich API for selecting and manipulating DOM elements, making it easier to manage complex structures.
- Scales: A comprehensive module for mapping data values to visual properties, such as mapping a range of numbers to a range of pixel values or colors.
- Axes: Tools for automatically generating interactive axes for charts.
- Layouts: Built-in algorithms for common visualization patterns like tree layouts, network layouts, and more.
- Animations: Robust support for creating smooth and performant transitions and animations.
Because D3 leverages standard web technologies, visualizations created with it are highly compatible across various browsers and devices. The open-source nature and large community contribute to extensive documentation, tutorials, and a wealth of examples.
While its power comes with a steeper learning curve compared to higher-level charting libraries, the control and customization offered by D3.js are unmatched for complex and unique data visualization requirements. It is a fundamental tool for developers who want to push the boundaries of what's possible with data on the web.
Pros & Cons
Pros
- Extreme flexibility and customization options.
- Leverages standard web technologies (HTML, SVG, CSS).
- Powerful data-driven approach for dynamic updates.
- Robust animation and transition capabilities.
- Large and active community with extensive resources.
- Modular design allows for lightweight implementations.
Cons
- Steep learning curve requiring strong web development skills.
- More verbose than higher-level charting libraries.
- Can be complex to implement simple charts compared to dedicated libraries.
- Debugging can be challenging.
What Makes D3.js Stand Out
Unmatched Control and Flexibility
Offers complete control over visual elements and how data is bound and transformed, enabling highly customized visualizations.
Leverages Web Standards
Built on HTML, SVG, and CSS, ensuring compatibility and accessibility across modern web browsers without relying on proprietary technology.
Powerful Data-Driven Transformations
Facilitates complex visual transformations and animations based directly on the underlying data.
Features & Capabilities
11 featuresExpert Review
Detailed Review of D3.js: The Powerhouse for Web Data Visualization
D3.js has established itself as a premier JavaScript library for crafting sophisticated data visualizations directly within web browsers. It operates on a fundamental principle: binding arbitrary data to a Document Object Model (DOM) and then applying data-driven transformations to that document. This approach, while requiring a deeper understanding of web technologies, unlocks a level of customization and flexibility unparalleled by many higher-level charting libraries.
Core Philosophy and Architecture
Unlike libraries that provide a predefined set of charts (like bar charts or pie charts) with limited customization options, D3 offers the building blocks. It empowers developers to select elements, append new elements, modify attributes and styles based on data, and create smooth transitions. This 'data-driven' methodology means that the visual representation is directly linked to the underlying data, making visualizations dynamic and responsive to changes.
The library is structured into numerous smaller modules, allowing developers to import only the specific functionalities they need. This modularity contributes to smaller file sizes and improved performance, though it also means understanding which modules are necessary for a given task.
Key Features and Capabilities
D3.js is rich in features that facilitate complex visualization creation:
- DOM Manipulation: D3 extends the standard DOM API with powerful selection methods, making it easier to select, modify, and add elements based on data.
- Scales: Essential for mapping data values (e.g., numbers, dates) to visual properties (e.g., pixel positions, colors, radii). D3 provides various scale types (linear, logarithmic, time, ordinal) to handle different data types and visual mappings.
- Axes: Works in conjunction with scales to automatically generate nicely formatted axes for charts, complete with ticks and labels.
- Layouts: Includes algorithms for common visualization patterns, such as tree layouts for hierarchical data, force layouts for network diagrams, and various geometric layouts.
- Transitions: A standout feature is D3's robust support for smooth, animated transitions between data states. This is crucial for creating engaging and informative visualizations that show changes over time or in response to user interaction.
- Event Handling: Provides methods for attaching event listeners to visual elements, enabling interactive features like tooltips, zooming, and filtering.
Learning Curve and Development Experience
It is important to acknowledge that D3.js has a steeper learning curve compared to libraries that abstract away much of the underlying web technology. Developers need a solid understanding of HTML, CSS, and especially SVG (Scalable Vector Graphics), as D3 often manipulates SVG elements directly. The 'data-driven' approach requires a shift in thinking compared to traditional imperative programming.
However, the investment in learning D3 pays off in terms of the power and flexibility gained. The official documentation is comprehensive, and there is a vast ecosystem of tutorials, examples, and community support available online. Debugging can sometimes be challenging due to the declarative nature of the library and the direct manipulation of the DOM.
Use Cases
D3.js is well-suited for a wide range of data visualization tasks, including:
- Creating custom and complex charts beyond standard types.
- Building interactive dashboards and data exploration tools.
- Visualizing network data and relationships.
- Developing geographic maps and visualizations.
- Creating infographics and artistic data representations.
- Implementing real-time data visualizations.
It is particularly valuable when unique visualization requirements or a high degree of interactivity are needed.
Conclusion
D3.js is a powerful and versatile library for web-based data visualization. Its core strength lies in its ability to directly bind data to the DOM and leverage web standards to create highly customized and interactive graphics. While it demands a greater understanding of underlying technologies and has a steeper learning curve than some alternatives, the control and flexibility it offers are unmatched. For developers seeking to create unique, complex, or deeply interactive data visualizations on the web, D3.js remains a top-tier choice and an essential tool in their arsenal.
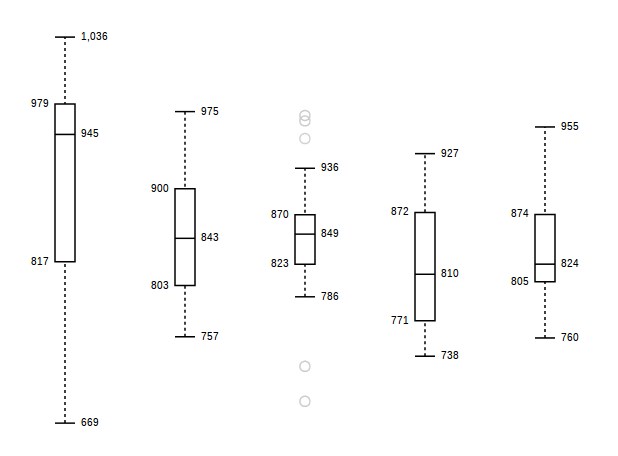
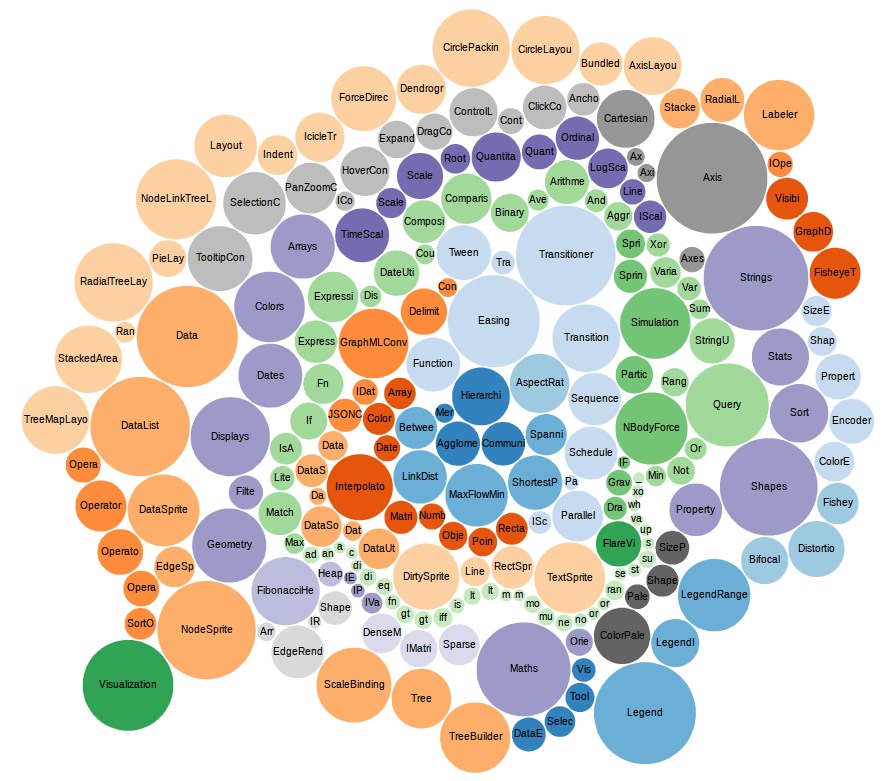
Screenshots