GnuPlot
Gnuplot is a portable, command-line driven graphing utility for interactive and non-interactive use. It can generate various plots of functions, data, and data fits in two and three dimensions. Widely used in scientific settings, it supports numerous output formats.
License
Open SourcePlatforms
About GnuPlot
Gnuplot: A Powerful Command-Line Plotting Utility
Gnuplot stands as a robust and versatile command-line driven graphing utility designed for creating high-quality plots and charts from mathematical functions, data files, and data fits. Its strength lies in its flexibility and wide range of capabilities, making it an indispensable tool for scientists, engineers, and data analysts who require precise control over their visualizations.
Key features include:
- Extensive Plotting Options: Gnuplot supports 2D plots (lines, points, errors, etc.) and 3D plots (surfaces, contours, etc.).
- Data Handling: Efficiently plot data read from various file formats.
- Function Plotting: Visualize mathematical functions directly using its built-in parsing capabilities.
- Data Fitting: Perform non-linear least-squares fitting of data using user-defined functions.
- Customization: Fine-tune virtually every aspect of the plot, including axes, titles, labels, legends, and line styles.
- Output Formats: Export plots to a vast array of formats, from vector graphics like PostScript and SVG to raster formats like PNG and JPEG.
- Scripting and Automation: Create scripts to automate plotting tasks and generate plots programmatically.
- Integration: Can be integrated with various other tools and programming languages.
Gnuplot's command-line interface, while potentially having a learning curve, provides unparalleled control and repeatability. It is particularly well-suited for generating plots in batch processing environments or integrating plotting into complex data analysis pipelines. Its long history and active development community ensure its continued relevance and reliability.
Pros & Cons
Pros
- Excellent control and customization through command line.
- Supports a wide variety of output formats.
- Powerful for scripting and automation.
- Efficiently handles large datasets.
- Capable of function plotting and data fitting.
Cons
- Steep learning curve due to command-line interface.
- Initial setup and configuration can be challenging for some users.
What Makes GnuPlot Stand Out
Powerful Command-Line Control
Offers extensive control and repeatability through its text-based interface, ideal for scripting and automation.
Broad Output Format Support
Generates output in a large number of formats, ensuring compatibility with various publications and applications.
Mature and Stable
With a long history of development, Gnuplot is a highly stable and reliable plotting tool.
Features & Capabilities
12 featuresExpert Review
Gnuplot: A Deep Dive into a Command-Line Plotting Powerhouse
Gnuplot is a venerable and widely-used plotting utility that occupies a unique niche in the data visualization landscape. Its core strength lies in its command-line interface, which provides unparalleled control and flexibility over the plotting process. For users comfortable with a text-based workflow, Gnuplot offers a level of customization and automation that is difficult to match with purely GUI-driven applications.
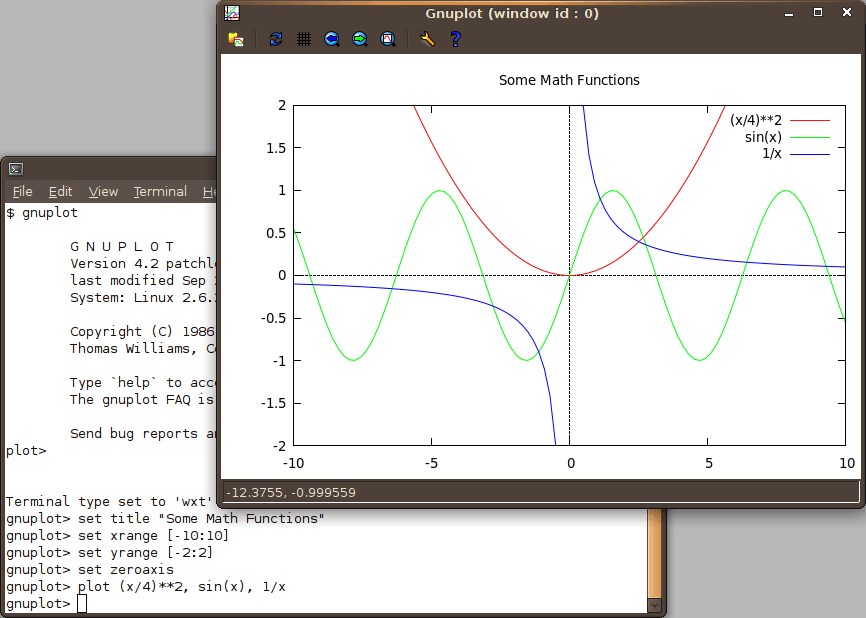
The initial interaction with Gnuplot is through a terminal window, where commands are entered to define data, functions, plot styles, and output settings. While this might seem daunting to newcomers accustomed to point-and-click interfaces, it is precisely this command-driven nature that makes Gnuplot so powerful for scripting and reproducible workflows. Once a plotting script is created, it can be easily executed repeatedly, ensuring consistent output even with changing data.
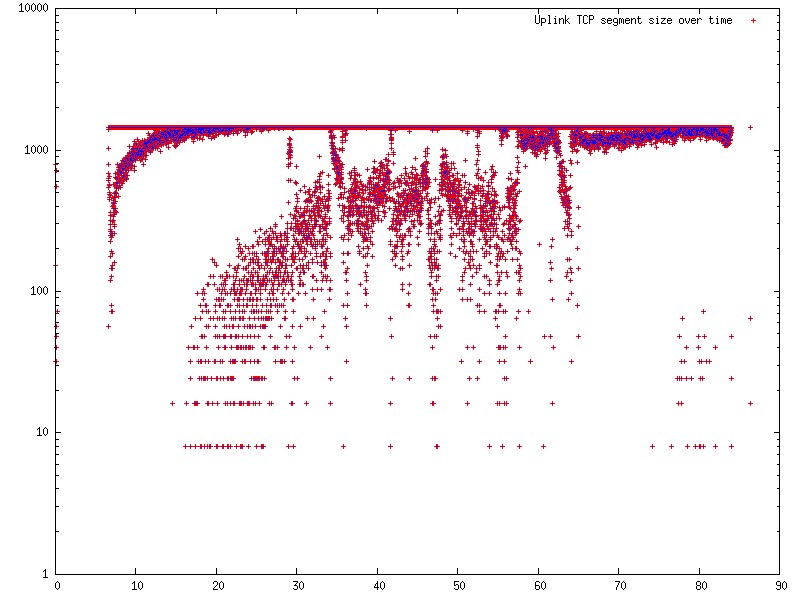
Gnuplot handles both plotting mathematical functions and visualizing data from external files with equal proficiency. Users can define complex functions using a syntax familiar to many programming languages and directly plot them. For data visualization, Gnuplot can read various delimited file formats, allowing precise control over which columns are used for axes and other plot attributes. The data fitting capabilities are also a significant advantage, enabling non-linear regression directly within the plotting environment.
One of Gnuplot's most impressive features is its vast support for output formats. From high-quality vector graphics like PostScript, EPS, and SVG, which are essential for scientific publications, to common raster formats like PNG, JPEG, and GIF, Gnuplot can generate plots suitable for a wide range of applications. This extensive format support ensures that plots can be seamlessly integrated into documents, presentations, and web pages.
Customization is a cornerstone of the Gnuplot experience. Users have granular control over virtually every element of a plot: axis ranges, labels, titles, legends, grid lines, line styles, point types, colors, and more. This level of detail, while requiring learning specific commands, allows for the creation of highly polished and informative visualizations tailored to specific needs.
The ability to run Gnuplot in a headless mode is particularly valuable for server-side processing and automated data analysis pipelines. It can be easily integrated with scripting languages like Python, enabling the programmatic generation of plots based on data processed by other tools.
However, the command-line interface, while powerful, represents the main barrier to entry for many users. The learning curve can be steep, and creating complex plots often requires consulting the comprehensive documentation. Debugging plotting scripts can also be less intuitive compared to visual interfaces.
In conclusion, Gnuplot is an exceptional tool for users who prioritize automation, reproducibility, and fine-grained control over their plots. Its robust feature set, extensive output format support, and scripting capabilities make it an invaluable asset in scientific research, engineering, and data analysis. While the command-line interface requires an initial investment in learning, the long-term benefits in terms of efficiency and control are significant. It remains a highly relevant and recommended tool for anyone serious about programmatic data visualization.
Screenshots