PingPlotter
PingPlotter is a network troubleshooting and monitoring tool that visually graphs network performance metrics like latency and packet loss across a network path, helping users identify and diagnose connectivity issues.
License
CommercialCategories
Platforms
About PingPlotter
Understand and Resolve Network Issues with PingPlotter
PingPlotter goes beyond a simple ping test, providing a comprehensive visualization of network performance from your computer to any target address. By continuously monitoring latency and packet loss across every hop in the network path, it empowers users to pinpoint exactly where performance degradations or outages are occurring. This makes it an indispensable tool for diagnosing a wide range of network problems, whether they are internal to your network or external with your ISP or a remote server.
Key Features and Benefits include:
- Visual Trace Route Analysis: See the path your data takes and the performance metrics at each step. This visual representation is far more intuitive than traditional command-line trace routes.
- Continuous Network Monitoring: Set up PingPlotter to monitor critical connections over time, collecting data that can reveal intermittent problems or historically track network health.
- Detailed Performance Data: Get granular data on latency, packet loss, and jitter for each hop, allowing for precise identification of bottlenecks or problematic nodes.
- Alerting and Notifications: Configure alerts based on performance thresholds to be notified automatically when network issues arise, enabling proactive problem resolution.
- Multiple Target Monitoring: Monitor multiple network targets simultaneously within a single interface, providing a holistic view of your network's connectivity.
- Historical Data Retention: Store historical performance data to analyze trends, compare performance over different time periods, and provide evidence of issues to service providers.
- Comprehensive Reporting: Generate reports summarizing network performance data, useful for documentation or sharing findings with others.
Whether you're troubleshooting slow internet, unstable online gaming, VoIP issues, or server connectivity problems, PingPlotter provides the detailed insights needed to effectively diagnose and communicate the root cause of the issue. Its user-friendly interface makes complex network data accessible to both technical and non-technical users.
Pros & Cons
Pros
- Provides a clear visual representation of network path and performance.
- Accurately pinpoints the location of network issues (latency, packet loss).
- Collects historical data for trend analysis and evidence.
- Offers customizable alerts for proactive monitoring.
- Measures jitter, useful for real-time applications.
Cons
- Free version has limited features compared to paid versions.
- Can initially seem overwhelming due to the amount of data displayed.
What Makes PingPlotter Stand Out
Visual Network Path Analysis
Offers a unique visual representation of the network path and hop-by-hop performance, making complex diagnostic data easily understandable.
Pinpoint Problem Location
Precisely identifies the specific hop(s) causing network latency or packet loss, empowering users to isolate the source of the issue.
Historical Evidence of Issues
Provides historical data that serves as concrete evidence when reporting network problems to Internet Service Providers or IT departments.
User-Friendly Interface
Presents detailed network diagnostics in an intuitive graphical interface, making it accessible for users of varying technical skill levels.
Features & Capabilities
12 featuresExpert Review
PingPlotter Review
PingPlotter is a powerful and intuitive network utility designed to help users identify and diagnose network connectivity issues. Unlike basic ping or traceroute commands, PingPlotter provides a continuous, graphical representation of network performance across the entire path from the user's computer to a target destination. This visual approach makes it significantly easier to pinpoint exactly where latency, packet loss, or jitter is occurring.
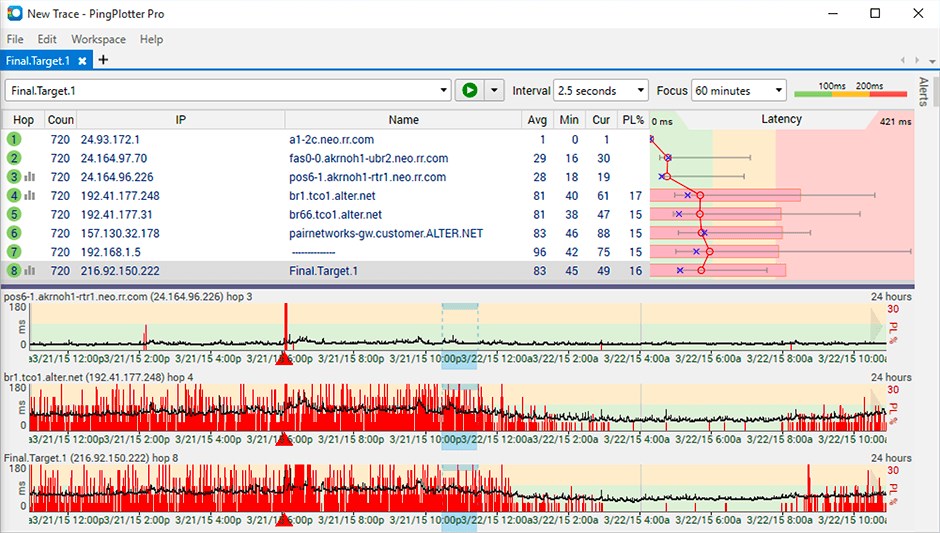
The core strength of PingPlotter lies in its ability to combine the functionality of a traceroute with continuous ping monitoring. When you specify a target (an IP address or hostname), PingPlotter performs a standard traceroute to identify all the hops (routers and servers) along the path. It then continuously sends packets to each of these hops and the final target, graphing the round-trip time (latency) and the percentage of packets lost for each hop over time. This data is displayed in a clear, easy-to-read interface with a list of hops at the top and interactive timeline graphs below.
The visual timeline graphs are where PingPlotter truly shines. They allow users to see how network performance to specific hops and the final destination changes over time. Spikes in latency or periods of high packet loss are immediately visible, and correlating these issues with specific hops allows users to determine whether the problem is local (e.g., within their home network or ISP) or further upstream. Hovering over the timeline provides granular details for specific points in time, and users can select time ranges to zoom in on problematic periods.
Key features that enhance PingPlotter's utility include:
- Comprehensive Hop Information: For each hop, PingPlotter displays the IP address, hostname, and even estimates geographical location, which can be helpful in understanding the network path.
- Jitter Measurement: Beyond just latency, PingPlotter measures jitter, the variation in latency. This is particularly important for troubleshooting real-time applications like VoIP and online gaming, where consistent packet delivery is more critical than just low latency.
- Alerting System: Users can configure alerts to be notified automatically when performance thresholds are breached. For example, an alert can be triggered if packet loss to the final destination exceeds a certain percentage for a specified duration. This is invaluable for monitoring critical connections without constant manual observation.
- Multi-Target Monitoring: PingPlotter allows monitoring of multiple destinations simultaneously in separate tabs, facilitating troubleshooting scenarios involving multiple services or sites.
- Historical Data & Reporting: The tool retains historical data, enabling analysis of past issues and identification of recurring problems. This data can also be exported into various report formats, which are useful for documentation or presenting evidence of network issues to service providers.
While the basic free version offers core tracing and graphing capabilities, PingPlotter Pro provides advanced features like multi-target monitoring, enhanced alerting, scripting, and integration options, catering to more demanding network administrators and businesses.
The user interface is generally intuitive, though the sheer amount of data presented can be overwhelming for complete beginners. However, with a little exploration, the layout becomes clear, and the graphical representations are much easier to interpret than command-line output.
In conclusion, PingPlotter is an excellent tool for anyone needing to diagnose network problems beyond simple connectivity checks. Its visual trace route, continuous monitoring, detailed performance metrics, and historical data capabilities make it a powerful asset for both individuals troubleshooting home network issues and IT professionals managing complex networks. It effectively translates complex network data into an understandable format, empowering users to identify and articulate the root cause of performance problems.
Screenshots