Gephi
Gephi is a powerful open-source software for exploring, visualizing, and manipulating networks and graphs of various types. It offers an intuitive interface for researchers, data scientists, and analysts to understand complex relational data.
About Gephi
- Dynamic Data Exploration: Interact with your network in real-time, applying filters and layouts to see how the structure changes.
- Sophisticated Layout Algorithms: Choose from a variety of force-directed and other algorithms to arrange nodes and edges in a meaningful way.
- Powerful Filtering and Partitioning: Segment your network based on attributes or topological properties to focus on specific subsets.
- High-Quality Rendering: Visualize even large graphs with smooth performance, including 3D rendering options.
- Data Import Flexibility: Easily import data from various formats, including spreadsheets and text-based formats.
- Extensible Architecture: Gephi's modular design allows for the addition of new features and plugins.
Pros & Cons
Pros
- Free and open-source
- Strong visualization and interactive exploration capabilities
- Variety of layout algorithms
- Extensible via plugins
- Supports common data formats
Cons
- Can be resource-intensive with large graphs
- User interface can feel dated
- Documentation can sometimes be incomplete for advanced topics
- Steep learning curve for some features
What Makes Gephi Stand Out
Open Source and Free
Gephi is freely available and open-source, making it accessible to a wide range of users and organizations.
Community Driven
Benefits from an active community of users and developers contributing to its development and support.
Powerful Visualization Engine
Capable of visualizing and interacting with large and complex networks with relatively good performance.
Extensible Plugin System
Users can add new features, data importers, and analysis algorithms through plugins.
Features & Capabilities
13 featuresExpert Review
Gephi Software Review
Gephi is a prominent open-source software application specifically designed for the visualization and exploration of large networks and graphs. It targets data analysts, researchers, social scientists, and anyone dealing with relational data that can be represented as nodes and edges. The software's primary strength lies in its ability to transform complex network datasets into intuitive and interactive visual representations, facilitating the discovery of patterns, structures, and insights that might be hidden in tabular data.
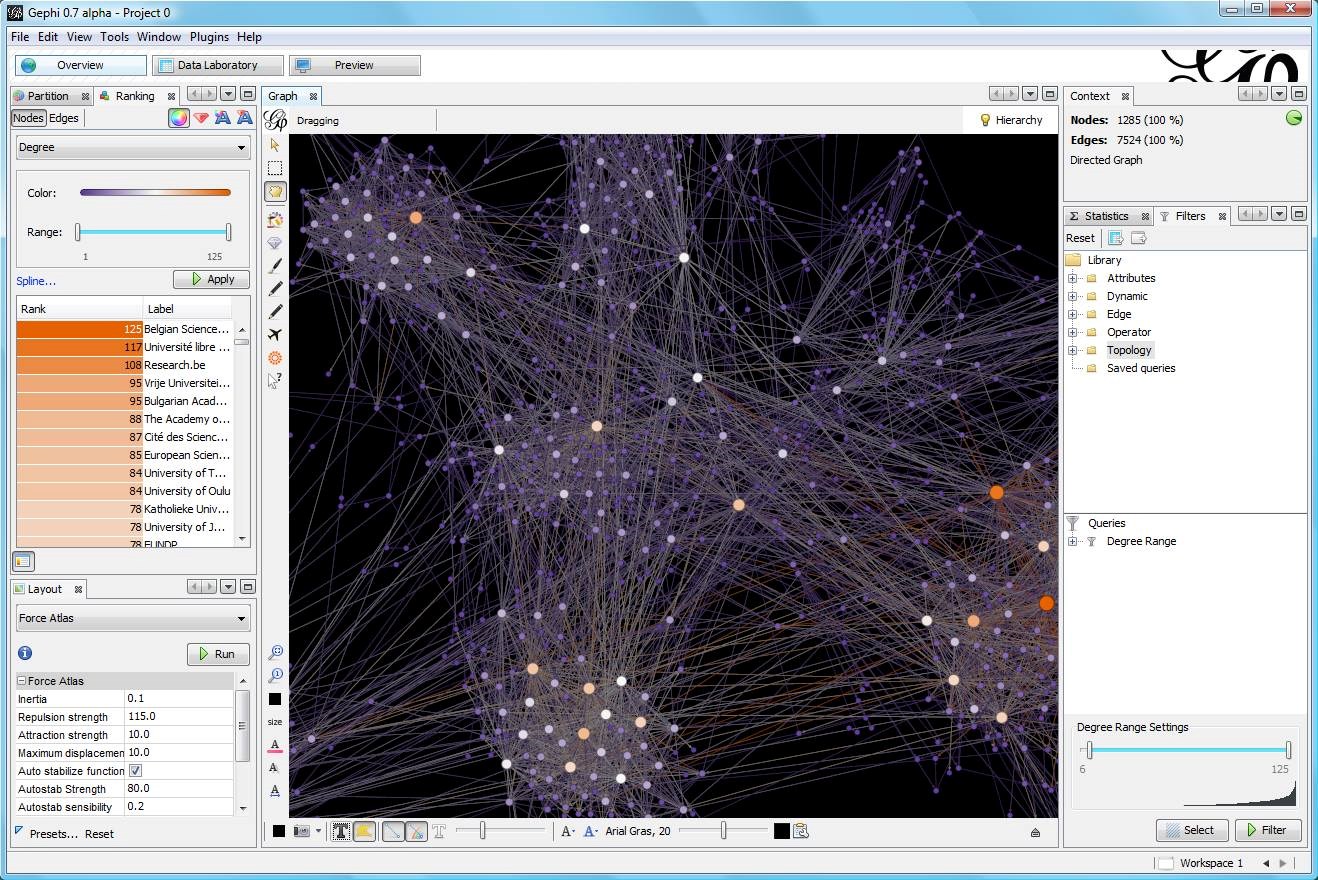
Core Functionality and User Experience
Upon launching Gephi, users are greeted with a relatively straightforward interface centered around the graph visualization window. The workflow typically involves importing data, applying layout algorithms, filtering and partitioning the network, and then exploring the resulting visualization. Data import is flexible, supporting common formats like CSV and GraphML, as well as spreadsheet formats like Excel, which is a significant convenience for many users. The integration of import capabilities is generally robust, although challenges can arise with poorly formatted input files.
Visualization and Layouts
The visualization engine in Gephi is one of its most compelling features. It handles moderately sized networks well, rendering nodes and edges with reasonable performance. The interactivity is a key aspect; users can zoom, pan, and select elements, and changes to layout or filtering are often reflected dynamically. Gephi offers a wide array of layout algorithms, ranging from popular force-directed methods like ForceAtlas2 and Fruchterman Reingold to more specialized options. Selecting the right layout is crucial for effective visualization, and experimentation is often required. While Gephi provides control over parameters for these algorithms, understanding their effects requires some learning.
Filtering and Partitioning
Gephi's filtering capabilities are powerful, allowing users to focus on specific subsets of the network based on various criteria, such as node degree, attributes, or network properties. The dynamic filter interface is intuitive, enabling users to see the impact of their selections in real-time. Partitioning allows for the visual grouping of nodes based on categorical attributes, which is excellent for highlighting different communities or types of entities within the network.
Features and Extensibility
Beyond core visualization, Gephi includes features for basic network analysis, such as calculating centrality measures (degree, betweenness, closeness), community detection algorithms, and basic statistics about the network structure. These integrated analysis tools are valuable for gaining quantitative insights alongside the visual exploration.
A significant advantage of Gephi is its modular architecture and plugin system. This allows developers and the community to extend the software's capabilities by adding new import formats, layout algorithms, analysis tools, and visualization options. The availability of plugins enhances Gephi's versatility and allows it to adapt to specific research or analysis needs. However, the quality and maintenance of plugins can vary.
Performance and Scalability
Gephi performs best with networks of moderate size (thousands to tens of thousands of nodes and edges). While it can handle larger graphs, performance can degrade significantly, especially during layout calculations and rendering. Memory usage can also become a concern with very large datasets. Users dealing with extremely large networks might need more specialized or distributed computing solutions, but for many common use cases, Gephi's performance is adequate.
Documentation and Community
Being an open-source project, Gephi relies on its community for support and documentation. The official documentation is available and covers core features, but it can sometimes be less detailed for advanced topics or troubleshooting. The Gephi community forum and online tutorials are valuable resources for users seeking help or wanting to learn specific techniques. The active community is a major strength, providing a collaborative environment for users.
Areas for Improvement
While powerful, Gephi is not without its limitations. The user interface, while functional, can sometimes feel a bit dated compared to modern commercial software. Handling and labeling text within visualizations, especially in dense networks, can be challenging. Export options, particularly for high-resolution or vector graphics suitable for publication, are available but sometimes require tweaking to get the desired output quality. Additionally, while basic editing is possible, Gephi is not a primary graph editing tool for complex manual manipulation.
Conclusion
Overall, Gephi is an excellent choice for anyone needing to visualize and explore network data. Its combination of open-source accessibility, powerful visualization features, interactive exploration capabilities, and extensibility through plugins makes it a valuable tool for researchers, analysts, and students. While it has limitations regarding scalability for extremely large graphs and requires some learning to master its full capabilities, its strengths in making complex relational data visually understandable are its primary asset. For many, Gephi remains the go-to software for network visualization and initial exploration.
Screenshots