Cacti
Cacti is a comprehensive network graphing and monitoring solution built upon the power of RRDTool. It provides a flexible and scalable platform for collecting, storing, and visualizing time-series data, making it an essential tool for network administrators to gain insights into performance and identify potential issues.
License
Open SourcePlatforms
About Cacti
Cacti stands as a robust and versatile platform tailored for network monitoring and performance analysis, leveraging the efficiency of RRDTool for data management and visualization. Its core strength lies in its ability to collect diverse data types from various sources and render them into informative graphs.
Key Capabilities:
- Data Collection Flexibility: Cacti supports a wide array of data input methods, including SNMP, scripts, and command line tools, allowing it to gather performance metrics from a broad spectrum of devices and applications.
- Powerful Graphing Engine: At the heart of Cacti is its sophisticated graphing engine, which enables users to create highly customizable graphs displaying multiple data sources and applying various functions for analysis. This visual representation simplifies the understanding of complex data trends.
- Scalability: Designed with scalability in mind, Cacti can accommodate monitoring requirements ranging from small networks to large, intricate enterprise environments, offering distributed data collection capabilities.
- Alerting and Notifications: While primarily a graphing tool, Cacti integrates with various plugins and external systems to provide alerting based on predefined thresholds, enabling proactive problem resolution.
- Customizable Dashboards: Users can build personalized dashboards to display key performance indicators and graphs relevant to their specific needs, providing a centralized view of critical network metrics.
- Template-Based Management: Cacti utilizes templates for devices, graphs, and data sources, streamlining the configuration process and ensuring consistency across the monitored environment.
Benefits for Network Administrators:
- Gaining deep insights into network performance and utilization.
- Identifying bottlenecks and potential performance issues.
- Tracking historical data for capacity planning and trend analysis.
- Monitoring the health and availability of network devices and services.
In essence, Cacti offers a powerful yet flexible framework for network monitoring, providing the tools necessary to effectively manage and optimize network infrastructure through comprehensive data collection and intuitive visualization.
Pros & Cons
Pros
- Highly customizable graphing options for detailed visualization.
- Flexible data collection methods support diverse environments.
- Leverages RRDTool for efficient time-series data management.
- Large and active community provides extensive support and plugins.
- Open-source and cost-effective solution.
Cons
- User interface can be less intuitive for new users.
- Basic built-in alerting requires integration with external tools for advanced features.
- Initial configuration and setup can be time-consuming.
- Scaling to very large environments may require careful optimization.
What Makes Cacti Stand Out
RRDTool Integration
Leverages the robust data storage and graphing capabilities of RRDTool for efficient time-series data management.
Extensive Community Support
Benefits from a large and active community offering extensive resources, plugins, and troubleshooting assistance.
Flexible Data Collection
Supports a wide variety of data input methods, making it adaptable to diverse monitoring needs.
Features & Capabilities
14 featuresExpert Review
Cacti: A Deep Dive into Network Graphing and Monitoring
Cacti is a well-established open-source network graphing and monitoring solution that has been a staple in IT environments for many years. Its foundation on RRDTool provides a powerful backend for managing time-series data, making it highly effective for visualizing trends and performance over time. This review examines Cacti's capabilities, usability, and overall value proposition.
Architecture and Core Functionality
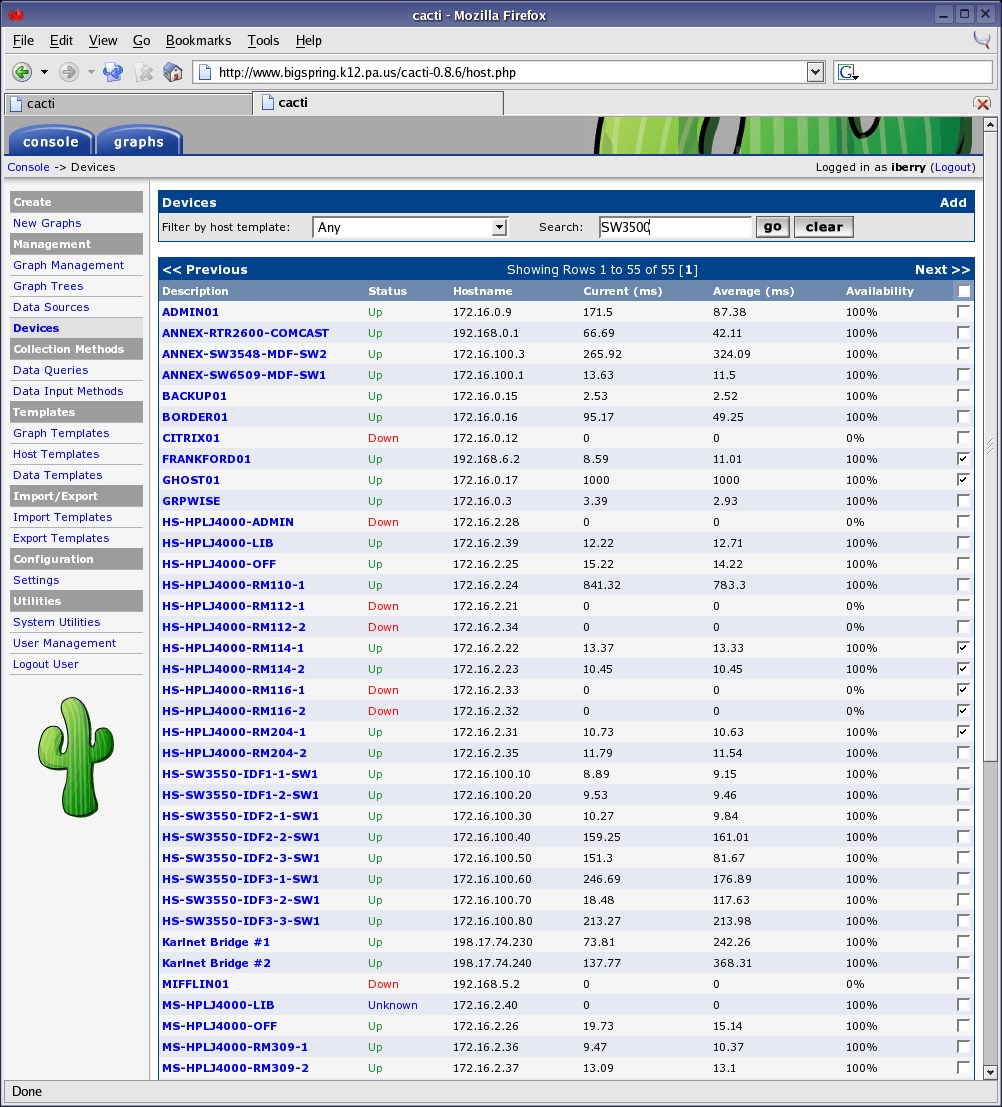
At its core, Cacti is a web-based frontend for RRDTool. It simplifies the process of collecting, storing, and displaying data in graphical format. The architecture is centered around polling devices or data sources at regular intervals and feeding that data into RRDTool databases. The web interface then allows users to configure data sources, design graphs, and build dashboards.
Key components include:
- Poller: The engine that collects data from configured sources. Cacti supports various pollers, including command-line and spine (a compiled C-based poller for improved performance).
- Web Interface: The primary user interface for configuration, monitoring, and visualization.
- RRDTool: The backend database and graphing engine responsible for storing and rendering the time-series data.
- Data Sources: Configuration entries defining how data is collected for a specific metric from a target device.
- Graphs: Visual representations of one or more data sources over time.
- Templates: Predefined configurations for devices, graphs, and data sources, significantly speeding up the setup process for common scenarios.
Strengths
One of Cacti's significant strengths is its flexibility. With support for SNMP, scripts, and command-line inputs, it can collect data from virtually any device or application that exposes relevant metrics. This adaptability makes it suitable for monitoring a wide range of infrastructure components, from network routers and switches to servers and even custom applications.
The graphing capabilities are another major plus. Users have extensive control over how data is displayed, including:
- Selecting data sources and applying functions (e.g., average, maximum, minimum).
- Customizing graph titles, labels, and colors.
- Defining time ranges for historical analysis.
- Overlaying multiple data series on a single graph for comparison.
The template system is a valuable feature for managing larger environments. Creating templates for common device types or monitoring requirements allows administrators to quickly onboard new devices and ensure consistency in monitoring configurations.
The open-source nature and large community contribute to Cacti's robustness and longevity. The active community provides support, develops plugins, and contributes to the ongoing development of the platform. This means a wealth of resources are available for troubleshooting, extending functionality, and finding pre-built solutions for common monitoring tasks.
Areas for Improvement
While powerful, Cacti's user interface can feel somewhat dated compared to some modern monitoring solutions. The configuration process, particularly for complex setups, can involve navigating through multiple menus and options, which might have a steeper learning curve for newcomers.
Out-of-the-box alerting capabilities are relatively basic. While Cacti integrates with external tools and plugins for more advanced alerting, configuring complex notification rules can require additional effort and knowledge of external systems.
Initial setup and configuration can be time-consuming, especially in enterprise environments with a large number of devices and diverse monitoring requirements. While templates help, the process of creating and refining data sources and graphs for specific needs can still be labor-intensive.
Scaling to very large environments can introduce performance considerations. While Cacti is designed to be scalable, optimizing the poller and database for high volume data collection requires careful planning and tuning.
Comparison with Alternatives
Compared to commercial monitoring platforms, Cacti offers a cost-effective solution with a high degree of customization. However, commercial tools often provide more polished user interfaces, integrated alerting, and agent-based monitoring options out-of-the-box.
Compared to other open-source monitoring tools like Zabbix or Nagios, Cacti's primary focus is on graphing and trend analysis. While Zabbix and Nagios are more oriented towards event-driven monitoring and alerting, Cacti excels at visualizing historical performance data and identifying long-term trends.
Conclusion
Cacti remains a highly capable and valuable tool for network graphing and monitoring, particularly for organizations that need a flexible and customizable solution. Its strengths in data collection, graphing, and leveraging the power of RRDTool make it ideal for understanding network performance over time. While the user interface and native alerting could be improved, the open-source nature and strong community support provide ample opportunities for customization and extending functionality. For IT professionals who value detailed performance analysis and are comfortable with a certain level of configuration effort, Cacti is a compelling choice. It is best suited for environments where in-depth historical data analysis and trend identification are critical for capacity planning and performance optimization.
Screenshots